Predicting Stock Prices Using GDP Growth Rates?
Another narrative and correlation we should question
In my last article I looked at one of the myths (or narratives) existing in the stock market – the correlation between inflation and gold – which can’t be backed up by data. Today we will look at another correlation or narrative: Higher GDP will lead to higher stock prices.
Correlation: Basically Correct
While there is no evidence for a positive correlation between inflation and gold prices that is holding up over the long term, the positive correlation between a growing GDP and rising stock prices would be much harder to disprove. When looking at different countries around the world and different timeframes, the correlation is sometimes higher, sometimes it is rather close to zero raising the question if there is a correlation at all and sometimes it is even negative, but over the long run a positive correlation exists.
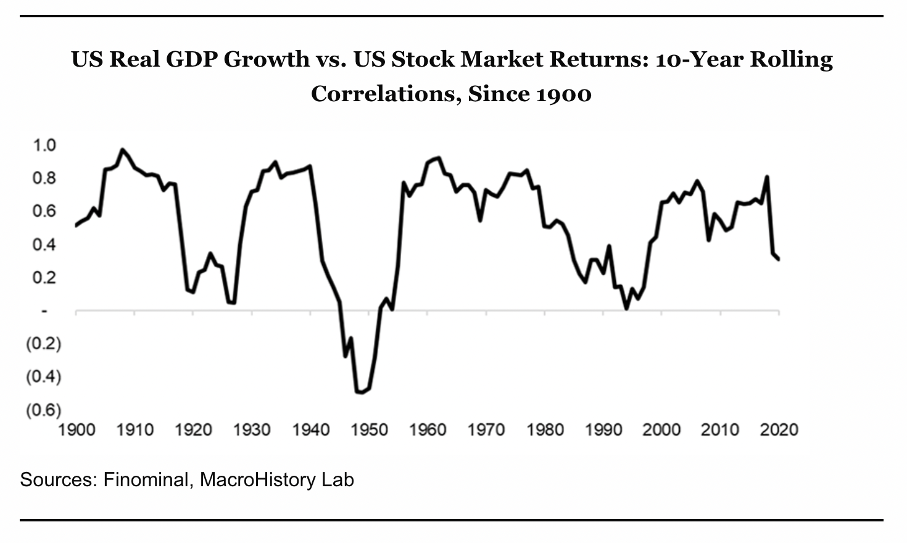
When looking at the United States and calculate correlations between the U.S. real GDP growth and the U.S. stock market returns on a 10-year rolling basis, we mostly see a positive correlation. Based on this data, we can argue for a long-term positive correlation between GDP growth and increasing stock prices.

However, we also must admit the huge fluctuations we can see since 1900 and especially the metric being close to zero in the 1920s and 1990s is indicating that there is no correlation. And in the 1940s and 1950s the correlation was even negative.
And I don’t want to disprove that over the long term (thinking decades) the correlation between a rising GDP and rising stock prices exists. And not only are stock prices increasing with GDP over the long run, we also see declining stock prices quite often in times of a recession (GDP contracting). But I will still show in the following article why this correlation has its flaws and can’t be used as an investment or trading strategy in shorter timeframes (several years) and while GDP certainly isn’t a reliable explanation for stock market movements.
United States
We start once again by looking at data from the United States – GDP growth in the United States and the performance of the S&P 500. And when looking at the last two decades, the positive correlation between the S&P 500 and GDP growth seems to be quite accurate.
Between Q1/09 and Q1/24 GDP grew 4.5% annually and the S&P 500 increased 14.7% every year clearly demonstrating a positive correlation (see chart 1). And when looking at the Great Financial Crisis between Q3/07 and Q1/09, GDP declined 0.6% on an annualized basis and the stock market declined 43.5% on an annualized basis – also in line with expectations according to the narrative. Additionally, we can look at the two decades between Q3/82 and Q1/00 with an annualized GDP growth of 6.4% and the S&P 500 growing 16.8% annually.
Aside from these handpicked examples we can find many other timeframes in which we see a positive correlation between GDP growth and a growing stock market. Of course, sometimes we see a very strong correlation and sometimes the correlation is weaker, but examples for this positive correlation are countless.
GDP Growing, Index Declining
But we can find examples where the gross domestic product was still growing, but the index nevertheless declined steeply. Between Q1/00 and Q3/02, GDP still increased 3.8% annually while an investment in the S&P 500 would have generate an annualized loss of 24.4%.
And especially when looking at the 1970s, we can look at several timeframes and see a growing GDP in combination with declining indices. Between Q4/68 and Q4/74, GDP increased 8.74% annualized – a high growth rate for GDP – but the S&P 500 declined 9.4% annualized (see chart 2). Between Q4/68 and Q3/82, GDP increased 9.49% annualized. In the same timeframe, an investment in the S&P 500 would have lost about 0.5% on an annual basis.
Here we should not forget that the 1970s (especially the late 1970s) were characterized by high inflation rates, which is explaining the high GDP growth but is also showing that losses (or even small gains) in the stock market were set off by high inflation rates.
Japan
We can also look at data from Japan as the country and its stock market is a great warning example for an underperforming stock market despite a still growing economy. The Japanese stock market peaked in December 1989, and it was only a few weeks ago that the Nikkei 225 could surpass the 1989 high again – after 35 years. This is one of the most striking examples for a so-called “lost decade” in the stock market – in this case it took 35 years.
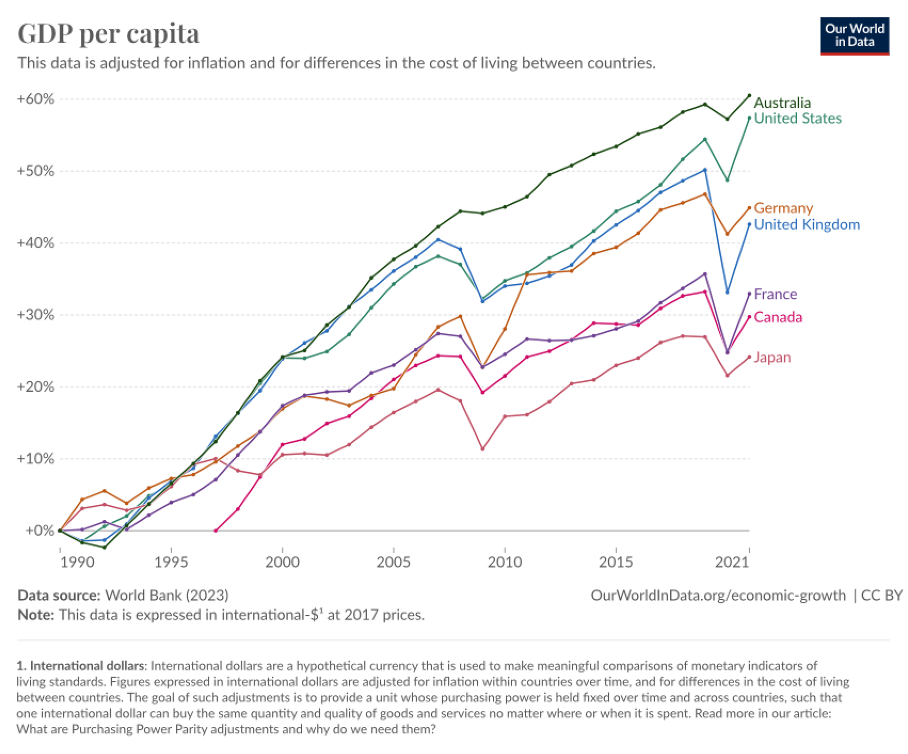
And when looking at the last ten years for example, Japan grew with a low pace and could not match the growth rates of other advanced economies – including Germany, France, Canada, or the United States. When looking at the data since 1990, the picture is not really different to the last ten years. Japan was clearly lagging most other advanced economies in economic growth. But Japan was growing during that timeframe.

As mentioned above, the Japanese stock market peaked in December 1989 and completely collapsed in the following years and decades. In the early 1990s, Japan grew its GDP still with a high pace. Between Q4/89 and Q4/90, GDP grew still 5.15% annualized, but the Nikkei 225 declined 57% annualized (see chart 3). And between Q4/89 and Q3/92 GDP still increased 2.9% annualized and the Nikkei 225 lost 33.0% annualized. Now one can argue that these are rather short timeframes and when looking at only a few years fluctuations play a huge role and might distort the picture. However, when looking at almost 20 years between Q4/89 and Q1/09, GDP was growing 0.78% annualized and the Nikkei 225 lost 8.5% annually.
We also find several timeframes in which the GDP was almost stagnating, but the index could grow with a solid pace. Between Q4/18 and Q4/23 GDP in Japan basically didn’t increase (0.17% annualized growth) but the Nikkei 225 nevertheless reported an annualized return of 6.3% in the same timeframe. If the correlation always held up, the stock market should have rather stagnated. You can also look at the chart above for yourself and calculate for different timeframes and you will see the correlation is far from perfect.
Weak Trading/Investment Signal
A positive correlation between GDP growth and increasing stock prices certainly makes more sense than a positive correlation between gold and inflation (see previous article). In case of gold, we could find timeframes for every combination – inflation low/very high and gold increasing/declining. In case of the correlation between GDP and stock prices it seems a little different. While we can find examples for GDP growing but the stock market declining, it seems almost impossible to find examples for GDP declining but stock market increasing (at least when looking at longer timeframes and advanced economies).
While such a correlation seems to make more sense, the chart at the beginning already showed huge fluctuations between a strong correlation and a very weak correlation. And what trading or investment information can be gained when in some cases a GDP growth close to zero is leading to double digit declines for the Nikkei 225 (see Q1/00 till Q1/09) and in other cases a GDP growth close to zero leads to 6.3% annualized growth for the Nikkei 225 (see Q4/18 till Q4/23).
Or how can we explain that 1.16% annualized GDP growth leads to 1.73% annualized increase for the Nikkei 225 (see Q3/92 till Q1/07) while only 0.17% annualized GDP growth leads to 6.3% annualized increased for the Nikkei 225 (see Q4/18 till Q4/23). In both cases we have a positive correlation, but good investing results based on this might be difficult to achieve.
Conclusion
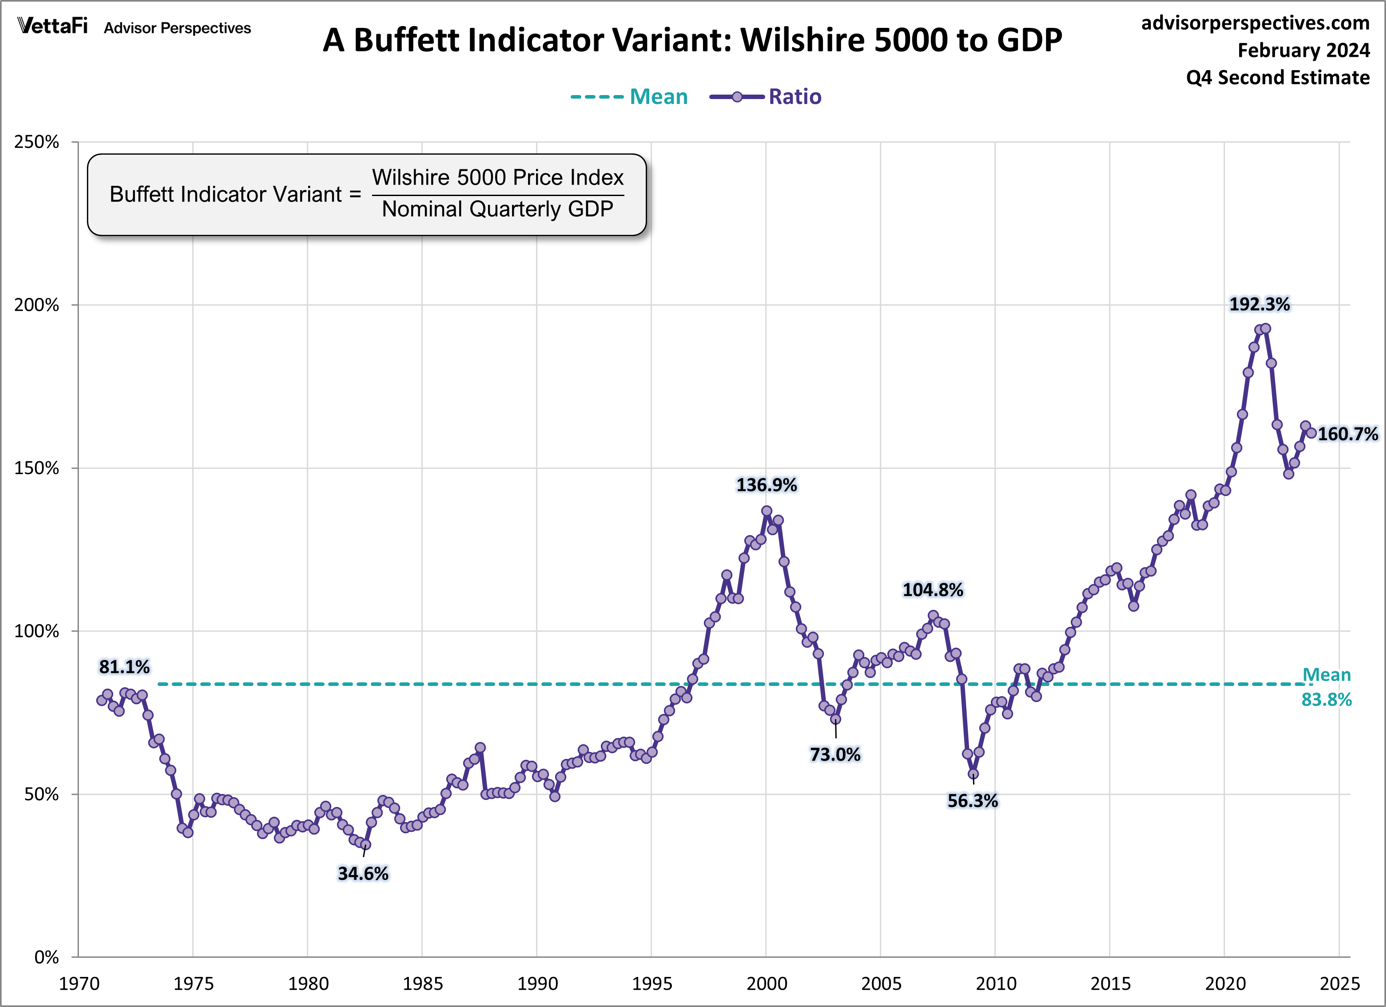
Another way to demonstrate that GDP growth and stock prices are not really correlated is by looking at valuation multiples – in this case the so-called Buffett Indicator. Assuming that there is a strong positive correlation between GDP and stock prices, the indicator should see not many fluctuations. But since 1970, we saw numbers as low as 35% and as high as 192%. And while we can’t deny that the multiple (or correlation) is in a certain range most of the time, we also can’t deny the fluctuations we are seeing between the different years and decades.

It seems extremely unlikely that GDP will increase over several decades and stocks will not follow at some point, but as Japan demonstrated it can take several decades before the correlation is positive again. However, assuming that quarterly GDP data is driving the stock price is similar nonsense as assuming inflation rates are driving gold prices.


